After 2 years of waiting, I finally received the Flipper Zero (F0) I backed via Kickstarter. The F0 is also known as “the tamogatchi for hackers”. I spent some time getting to know the device and noticed that one thing missing was the ability to scan and tx/rx Bluetooth Low-Energy (BLE) traffic for testing. The device has BLE (it uses it for connecting to the mobile app, and possible other uses that I’m unaware of) but it doesn’t seem like it is user-controllable. I set off to try to find a way to access this functionality, as there were hints in the firmware source code that this was possible. I didn’t get there yet but in the process I did learn a thing or two about debugging an embedded device which I wanted to document and share for others to learn from.
Note: I am using a Mac with Docker for the build environment. Linux should be similar. Not sure how comparable these instructions will be on Windows.
Items Needed:
- Flipper Zero
- qFlipper device updater
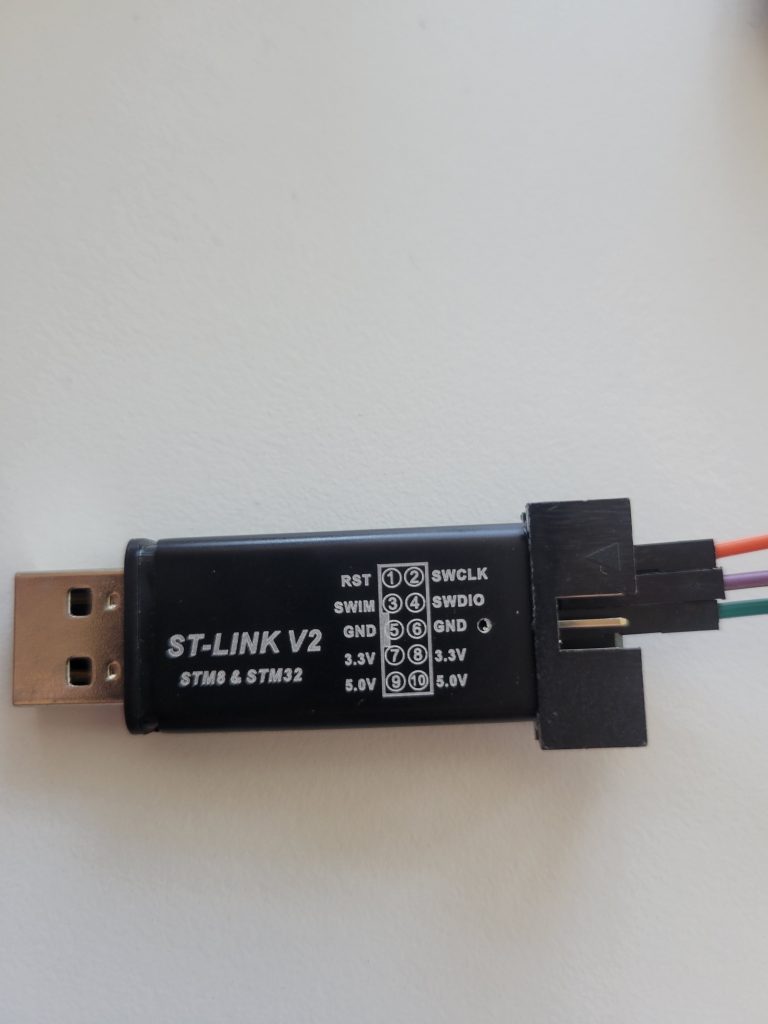
- ST-Link v2 hardware debugger (I’m using a clone, like this one)
- The one linked to is relatively expensive for clones, but it’s from Amazon and ships quickly. I bought a few packs of 5 a couple of years ago from AliExpress for only a few dollars for another project, but those take a long time to ship.
- 3x male-to-female jumpers for connecting the F0 to the ST-Link
- Visual Studio Code
- Cortex-Debug VS Code Plugin
- OpenOCD
- Should be able to install via Homebrew/apt/yum/etc with
brew/apt/yum install openocd
- Should be able to install via Homebrew/apt/yum/etc with
- GDB
- Likely already installed, but install with your package manager if needed
- Flipper Zero source code from official repo
- Build environment (I used the Docker build env from the F0 repo)
- Any additional associated dependencies
Building/Flashing Firmware:
- Clone firmware repo to your local machine and enter the directory
- Start the Docker container build environment
docker-compose up -d
- Build the firmware
docker-compose exec dev make DEBUG=0- Will take some time depending on your machine specs. When finished, firmware binaries should be in the
dist/f7folder.
- Flash your compiled firmware to your device with qFlipper using the “install from file” option
- Target file is
dist/f7/flipper-z-f7-full-local-git_commit.dfu
- Target file is
Connecting the ST-Link:
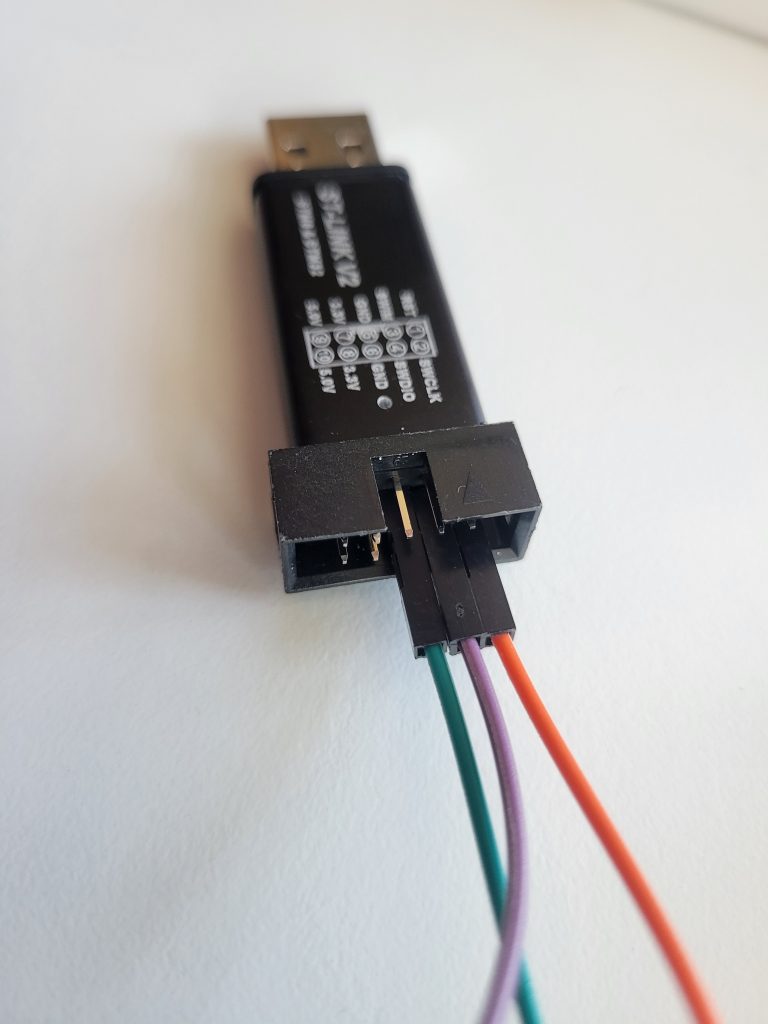
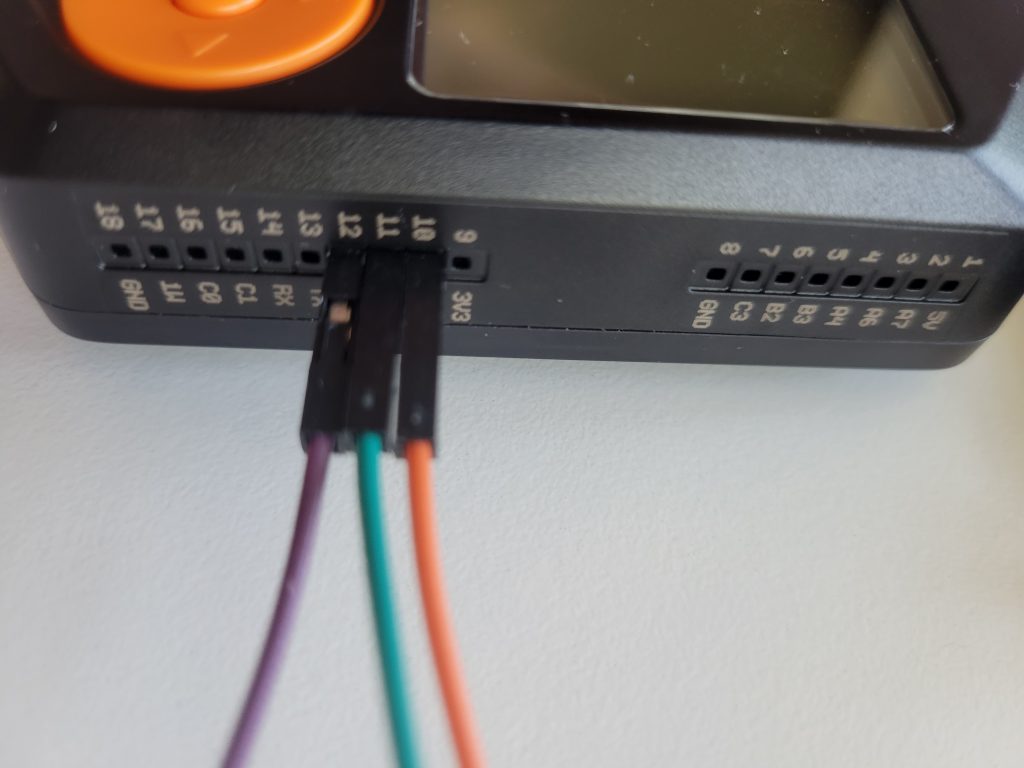
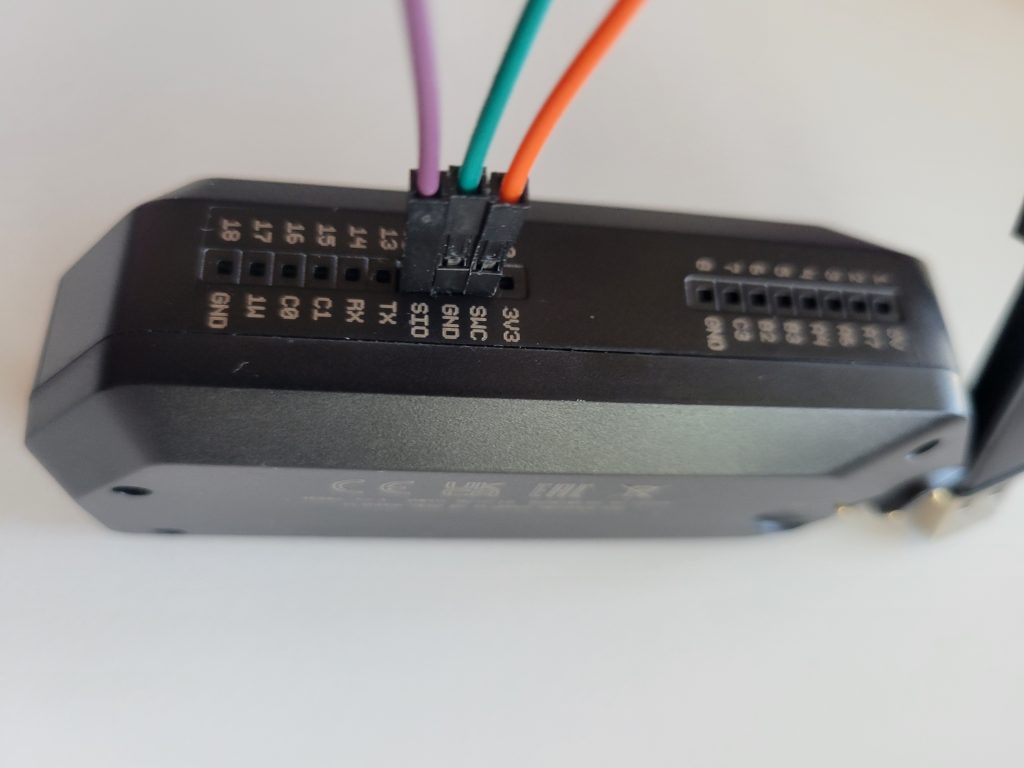
- Connect pins 2 (SWCLK), 4 (SWDIO), and 6 (GND) from the ST-Link to pins 10 (SWC), 12 (SIO), and 11 (GND) on the Flipper
- Plug the ST-Link into your USB port and power-on the Flipper
Debugging with VS Code:
- Install Cortex-Debug VS Code Plugin
- Create a symlink in the F0 repo you cloned pointing to itself called
projectcd flipperzero-firmware; ln -s . project- This is so the debugger can find the firmware source at the same relative path that it had when building within Docker (where the fw repo directory is called “project”).
- Using VS Code, use the “Open Folder” option to open the firmware repo root folder
- After ensuring the Cortex-Debug plugin is enabled create a new Launch Config (launch.json) in VS Code with the following:
- Your “executable” line will likely have a different commit number (7d499241, in the example); make sure you update that.
{
    "version": "0.2.0",
    "configurations": [
        {
            "name": "Cortex Debug",
            "cwd": "${workspaceFolder}",
            "executable": "./dist/f7/flipper-z-f7-firmware-local-7d499241.elf",
            "request": "attach",
            "type": "cortex-debug",
            "servertype": "openocd",
            "configFiles": ["interface/stlink.cfg", "./debug/stm32wbx.cfg"],
            "openOCDLaunchCommands": ["transport select hla_swd", "init"]
        }
    ]
}
- Launch the debugger (F5). The debugger should attach and the device should immediately pause, allowing for interaction via the debug console panel at the bottom.
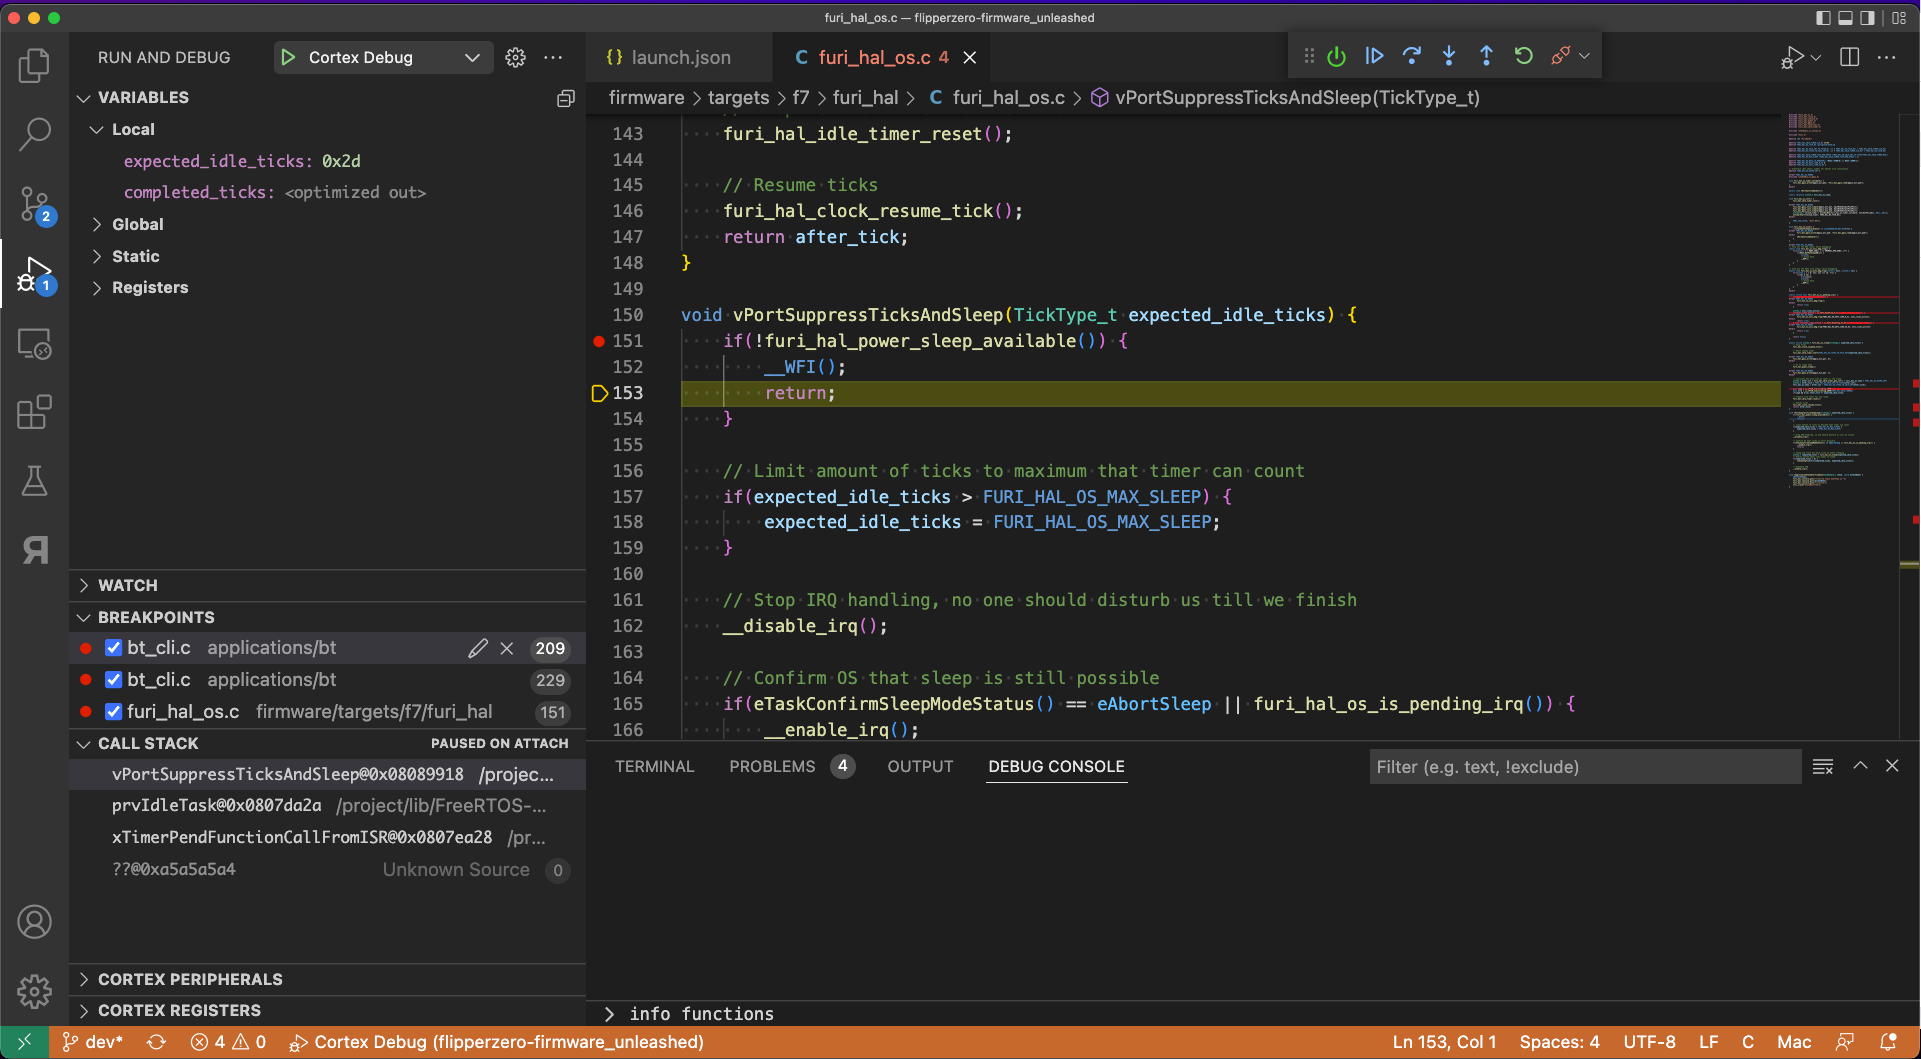
- Try typing a GDB command into the debug console, such as “info functions”. This should output all functions defined within the firmware.
- Set breakpoints wherever you want in the code and then unpause (continue) device execution by clicking the “Play/Pause” button in the debugger dialog. Once a breakpoint is hit the device will pause and you can examine values of variables or execute functions on your own.
- To execute a function manually, for example, printf to write to the console:
print (void) printf(\"test\")- Note: to view this output you need to connect to the Flipper from the CLI using a terminal emulator
picocom -b 115200 /dev/tty.usbmodemflip_your_device_name- Once connected with a prompt, pause the debugger, run the “printf” function listed, and then press “Enter” at the prompt. Then unpause the debugger. It’ll then print “test” to the terminal emulator console.
- To execute a function manually, for example, printf to write to the console: